Considerations for Benthic Harmful Algal Bloom Detection and Monitoring in Virginia Free-flowing Freshwater Rivers (Version 1) Archives

Entry Thumbnail

Considerations for Benthic Harmful Algal Bloom Detection and Monitoring in Virginia Free-flowing Freshwater Rivers (Version 1)

The Commonwealth of Virginia currently does not have an active Harmful Algal Bloom (HAB) surveillance program for benthic algae. Rather, it has a response-based program triggered by reports of suspected benthic HABs from the public and/or field observations made by state agency staff. The Virginia Department of Health (VDH) coordinates the Commonwealth’s responses to suspected benthic HAB events. Virginia Department of Environmental Quality (DEQ) normally conducts the initial response to any potential HAB, which may include visits to the HAB site for visual observations and collection of water column samples above or near the benthic algal mats. DEQ does not collect algal material from solid mats, benthic or floating, and has limited resources to commit beyond the initial response investigation of reported potential HABs. VDH is charged with the responsibility to weigh the available evidence and determine whether there is sufficient information to issue an advisory or alert notifying the public of possible risk due to the presence of harmful algae.

Advisories may be issued based on confirmed, quantitative data such as an exceedance of a toxin threshold measured in the water column. Alerts may be based, partially or fully, on qualitative information such as the widespread presence, or suspected presence, and extent of solid floating/benthic mats or scums. The subsequent benthic HAB response monitoring program must therefore consider protocols to be implemented in both circumstances, i.e., an advisory based on confirmed, quantitative measurements versus a qualitative “abundance of caution” alert informing the public of a possible health risk.

This project report describes systematic protocols that could be implemented if an advisory or alert is issued by VDH for a benthic HAB event. The report identifies the information needed to issue an advisory or alert, the recommended actions, an effective schedule of activities, and the resources needed to characterize the nature and extent of the HAB and implement the protocols. The suggested monitoring program considers the conditions and information that led to the HAB advisory or alert. The report describes how decision-makers are informed of the health risks associated with recreational swimming, fishing, and other water contact activities.

Entry Thumbnail

Stream Biological Health in the Chesapeake Bay Watershed

To learn more about this project and find interactive maps, check out the webpage for “Chessie BIBI” Index for Streams .

Executive Report

This report offers a numeric value for the 2008 Baseline referenced in the 2014 Chesapeake Agreement’s stream health goal as well as evidence of a net improving trend in stream health in the Chesapeake watershed. The report demonstrates a process for tracking progress in achieving the stream health goal to “improve health and function of ten percent of stream miles above the 2008 baseline.” The bioregion, family-level version of the Chesapeake Basin-wide Index of Biotic Integrity, or “Chessie BIBI,” is used to quantify stream health. The index is calculated from macroinvertebrate data collected by state, federal, county, and volunteer monitoring programs with kick net methods and was developed specifically for 1st – 4th order streams in the Chesapeake watershed (Smith et al. 2017). The 2008 Baseline is the 2006 – 2011 period because it encompasses all sampling schedules of the watershed’s state monitoring programs, most of which employ rotational sampling.

Gaps in the monitoring data’s spatial and temporal coverage make it difficult to directly estimate percentages of healthy streams in the pre-baseline (2000 – 2005), baseline, and subsequent “first interval” (2012 – 2017) periods. Statistical analyses indicate approximately 61.7% (~89,317 miles) of non-tidal stream miles likely supported healthy macroinvertebrate communities in the baseline period. The percentage increased to 67.8% (~98,049 miles) in the first interval. Despite this roughly 6% net improvement, some areas of the watershed show degrading trends. The net improving trend, however, suggests the collective impact of multiple environmental stressors on streams may be slowly lessening in many parts of the Chesapeake watershed. Identifying which factors are responsible for the net improvement would be speculative at this point, although long-term efforts to conserve forests, preserve and restore riparian corridors and wetlands, mitigate acid rain and mine drainage, slow stormwater runoff, and reduce nutrients and sediment loads have all likely contributed. Metrics for a variety of environmental stressors are currently being explored and will help future investigations of stream macroinvertebrate responses to those stressors. They can help explain why the current trend is happening.

The purpose of this report is to present the monitoring-based results and provide CBP with a process for tracking progress in achieving the Chesapeake watershed’s stream health goal. The process differs in some respects from those of the state agencies who use the data differently and for state regulatory purposes. We fully expect the Chessie BIBI results will also differ from state results at times, even though the underlying raw data are the same. The Chessie BIBI can be used for inter-jurisdictional, watershed-based planning and evaluation.

Entry Thumbnail

Explainable machine learning improves interpretability in the predictive modeling of biological stream conditions in the Chesapeake Bay Watershed, USA

Anthropogenic alterations have resulted in widespread degradation of stream conditions. To aid in stream restoration and management, baseline estimates of conditions and improved explanation of factors driving their degradation are needed. We used random forests to model biological conditions using a benthic macroinvertebrate index of biotic integrity for small, non-tidal streams (upstream area ≤200 km2) in the Chesapeake Bay watershed (CBW) of the mid-Atlantic coast of North America. We utilized several global and local model interpretation tools to improve average and site-specific model inferences, respectively. The model was used to predict condition for 95,867 individual catchments for eight periods (2001, 2004, 2006, 2008, 2011, 2013, 2016, 2019). Predicted conditions were classified as Poor, FairGood, or Uncertain to align with management needs and individual reach lengths and catchment areas were summed by condition class for the CBW for each period. Global permutation and local Shapley importance values indicated percent of forest, development, and agriculture in upstream catchments had strong impacts on predictions. Development and agriculture negatively influenced stream condition for model average (partial dependence [PD] and accumulated local effect [ALE] plots) and local (individual condition expectation and Shapley value plots) levels. Friedman’s H-statistic indicated large overall interactions for these three land covers, and bivariate global plots (PD and ALE) supported interactions among agriculture and development. Total stream length and catchment area predicted in FairGood conditions decreased then increased over the 19-years (length/area: 66.6/65.4% in 2001, 66.3/65.2% in 2011, and 66.6/65.4% in 2019). Examination of individual catchment predictions between 2001 and 2019 showed those predicted to have the largest decreases in condition had large increases in development; whereas catchments predicted to exhibit the largest increases in condition showed moderate increases in forest cover. Use of global and local interpretative methods together with watershed-wide and individual catchment predictions support conservation practitioners that need to identify widespread and localized patterns, especially acknowledging that management actions typically take place at individual-reach scales.

Find more information on the ScienceDirect page.

Entry Thumbnail

Potomac River Water Quality at Great Falls: 1940 – 2019

The U.S. Army Corps of Engineers operates Washington Aqueduct and provides drinking water to the Washington, D.C. area. Washington Aqueduct routinely samples its source of water, the Potomac River. Each year, it reports the monthly averages for basic water parameters and several pollutants and metals. Reports since 2001 are available online. Reports from 1905 to 2000, however, had limited distribution and their legibility has faded over time.

Dr. Norbert A. Jaworski recognized the historical value of these reports. To prevent their loss, he digitized the monthly values for several parameters. The Interstate Commission on the Potomac River Basin (ICPRB) later updated his dataset through 2019 and checked the entered data for accuracy. This report focuses on changes in temperature, hardness, pH, total solids, chloride, nitrate, and sulfate over the 80 years since ICPRB was formed in 1940. Visual representations (“heatmaps”) and trend analysis show significant increasing trends in all these parameters except nitrate. The report is intended to introduce the historical Washington Aqueduct water quality data to a broader audience and highlight their potential value to Potomac studies.

The Supplemental Materials document contains additional graphical representations of the data.

See the video summary of the report:

Entry Thumbnail

Rapid Response Survey of Cyanobacteria Toxin Levels Downstream of North Fork Shenandoah River Algal Bloom After Tropical Storm Ida, 2021

The Virginia Department of Health issued a Harmful Algae Bloom (HAB) Advisory for a 53-mile stretch of the North Fork of the Shenandoah River on August 10, 2021 (Figure 1, left). Samples from multi-species algal mats on the river bottom contained harmful levels of toxins produced by cyanobacteria. Three weeks later, Tropical Storm Ida passed over the North Fork, dumping torrential rain on the watershed. Sharply rising streamflows were expected to scour the benthic algal mats, potentially lysing their cells and releasing toxins as they washed downstream. The ICPRB’s Emergency River Spill Model (ERSM) indicated the scoured material’s leading edge would reach the Potomac River mainstem by September 2nd – 4th and Great Falls near Washington, D. C. by September 3rd – 6th.

Virginia Department of Environmental Quality staff confirmed the algal mats were scoured off the river bottom. Water samples collected by ICPRB at the Shenandoah River mouth indicate the storm’s high flows diluted the algal cells and their associated toxins to below-detection levels before they reached the Potomac River. If flows had been less intense, we hypothesize the scoured material and toxins could potentially have reached the Potomac River mainstem. More advanced flow modeling and additional sampling during algal blooms could better characterize the potential transport of scoured or senescing algal blooms in the Shenandoah River under different river conditions.

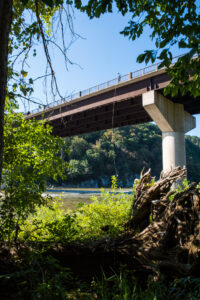
Scientist sends testing equipment attached to a rope over the side of a bridge. Shenandoah river is below the bridge.

Rt. 340 bridge over Shenandoah River near Harpers Ferry, WV

Entry Thumbnail

Linking Altered Flow Regimes to Biological Condition: an Example Using Benthic Macroinvertebrates in Small Streams of the Chesapeake Bay Watershed

Regionally scaled assessments of hydrologic alteration for small streams and its effects on freshwater taxa are often inhibited by a low number of stream gages. To overcome this limitation, we paired modeled estimates of hydrologic alteration to a benthic macroinvertebrate index of biotic integrity data for 4522 stream reaches across the Chesapeake Bay watershed. Using separate random-forest models, we predicted flow status (inflated, diminished, or indeterminant) for 12 published hydrologic metrics (HMs) that characterize the main components of flow regimes. We used these models to predict each HM status for each stream reach in the watershed, and linked predictions to macroinvertebrate condition samples collected from streams with drainage areas less than 200 km2. Flow alteration was calculated as the number of HMs with inflated or diminished status and ranged from 0 (no HM inflated or diminished) to 12 (all 12 HMs inflated or diminished). When focused solely on the stream condition and flow-alteration relationship, degraded macroinvertebrate condition was, depending on the number of HMs used, 3.8–4.7 times more likely in a flow-altered site; this likelihood was over twofold higher in the urban-focused dataset (8.7–10.8), and was never significant in the agriculture-focused dataset. Logistic regression analysis using the entire dataset showed for every unit increase in flow-alteration intensity, the odds of a degraded condition increased 3.7%. Our results provide an indication of whether altered streamflow is a possible driver of degraded biological conditions, information that could help managers prioritize management actions and lead to more effective restoration efforts.

The report has been published in Environmental Management.

Entry Thumbnail

Nutrient limitation of phytoplankton in Chesapeake Bay: Development of an empirical approach for water-quality management

Understanding the temporal and spatial roles of nutrient limitation on phytoplankton growth is necessary for developing successful management strategies. Chesapeake Bay has well-documented seasonal and spatial variations in nutrient limitation, but it remains unknown whether these patterns of nutrient limitation have changed in response to nutrient management efforts. We analyzed historical data from nutrient bioassay experiments (1992–2002) and data from long-term, fixed-site water-quality monitoring program (1990–2017) to develop empirical approaches for predicting nutrient limitation in the surface waters of the mainstem Bay. Results from classification and regression trees (CART) matched the seasonal and spatial patterns of bioassay-based nutrient limitation in the 1992–2002 period much better than two simpler, non-statistical approaches. An ensemble approach of three selected CART models satisfactorily reproduced the bioassay-based results (classification rate = 99%). This empirical approach can be used to characterize nutrient limitation from long-term water-quality monitoring data on much broader geographic and temporal scales than would be feasible using bioassays, providing a new tool for informing water-quality management. Results from our application of the approach to 21 tidal monitoring stations for the period of 2007–2017 showed modest changes in nutrient limitation patterns, with expanded areas of nitrogen-limitation and contracted areas of nutrient saturation (i.e., not limited by nitrogen or phosphorus). These changes imply that long-term reductions in nitrogen load have led to expanded areas with nutrient-limited phytoplankton growth in the Bay, reflecting long-term water-quality improvements in the context of nutrient enrichment. However, nutrient limitation patterns remain unchanged in the majority of the mainstem, suggesting that nutrient loads should be further reduced to achieve a less nutrient-saturated ecosystem.

Published in the Journal of Water Research, Volume 188, January 2021:
https://doi.org/10.1016/j.watres.2020.116407

Entry Thumbnail

Planning Assistance to States: Jennings Randolph Lake Scoping Study Phase II Report

The watershed of the North Branch Potomac River experienced severe environmental degradation and flooding in the 20th century. A dam across the river mainstem was completed in 1982, creating Jennings Randolph Lake. The lake and dam are operated by the U. S. Army Corps of Engineers for four authorized purposes: control floods, dilute downstream pollution, supply drinking to Washington DC during droughts, and provide recreation. Water quality in the North Branch watershed has improved considerably since the dam was built due to many factors, including regulatory enforcement, mine runoff mitigation, wastewater treatment, infrastructure improvements, forest regrowth and the abatement of acid rain (see ICPRB report 19-4). This pilot study was done to determine if an update of the 1997 Reservoir Regulation manual is appropriate at this time. The report reviews and evaluates each of the authorized purposes in terms of their original management goals and objectives, current relevance, and future application.

A copy of the report is available here.

Entry Thumbnail

A water quality binning method to infer phytoplankton community structure and function

Aspects of phytoplankton community structure (e.g., taxonomic composition, biomass) and function (e.g., light adaptation, net oxygen production, exudation) can be inferred with a binning method that uses water transparency (Secchi depth), dissolved inorganic nitrogen, and ortho-phosphate to classify phytoplankton habitat conditions in the surface mixed layer. The method creates six habitat categories, forming a disturbance scale from turbid, nutrient-enriched waters (“degraded”) to clear waters with bloom-limiting nutrient concentrations (“reference”). Across this disturbance scale, estuarine phytoplankton exhibit strong differences in chlorophyll a, count-based biomass, trophic mode, average cell size, photopigment cell content, taxonomic dominance, and the frequency of algal blooms. Differences in ambient dissolved oxygen and dissolved organic carbon are also observed. Two alternate states are apparent, separated primarily by water transparency, or clarity.Water transparency determines cellular light-adaptation and the potential for photosynthesis and growth; nutrient concentrations determine how much of that potential can be realized if and when light becomes available. In Chesapeake Bay, Secchi depth thresholds separating the two states are 0.7–0.9 m in shallow, well-mixed, low salinity waters and 1.2–2.1 m in deeper, stratified, higher salinity waters. The water quality binning method offers a conceptual framework that can be used to infer the overall state of a phytoplankton population more accurately than chlorophyll a alone.

The article was published in Estuaries and Coasts (2020). DOI link: https://doi.org/10.1007/s12237-020-00714-3. Please contact us for a full copy of the report.